How to use Zendro’s graphical user interface
Table of contents
Zendro’s graphical point-and-click user interface is accessible in a web browser, as a single page application (SPA). By default it’s available at http://localhost:8080 — see the Quickstart guide to set up a local instance with the same demo data shown in the screenshots below (three countries, nine cities and four rivers).
Zendro’s home graphical interface looks similar to the image below. It can, of course, be customised (by whoever installed Zendro) to show whatever you prefer:
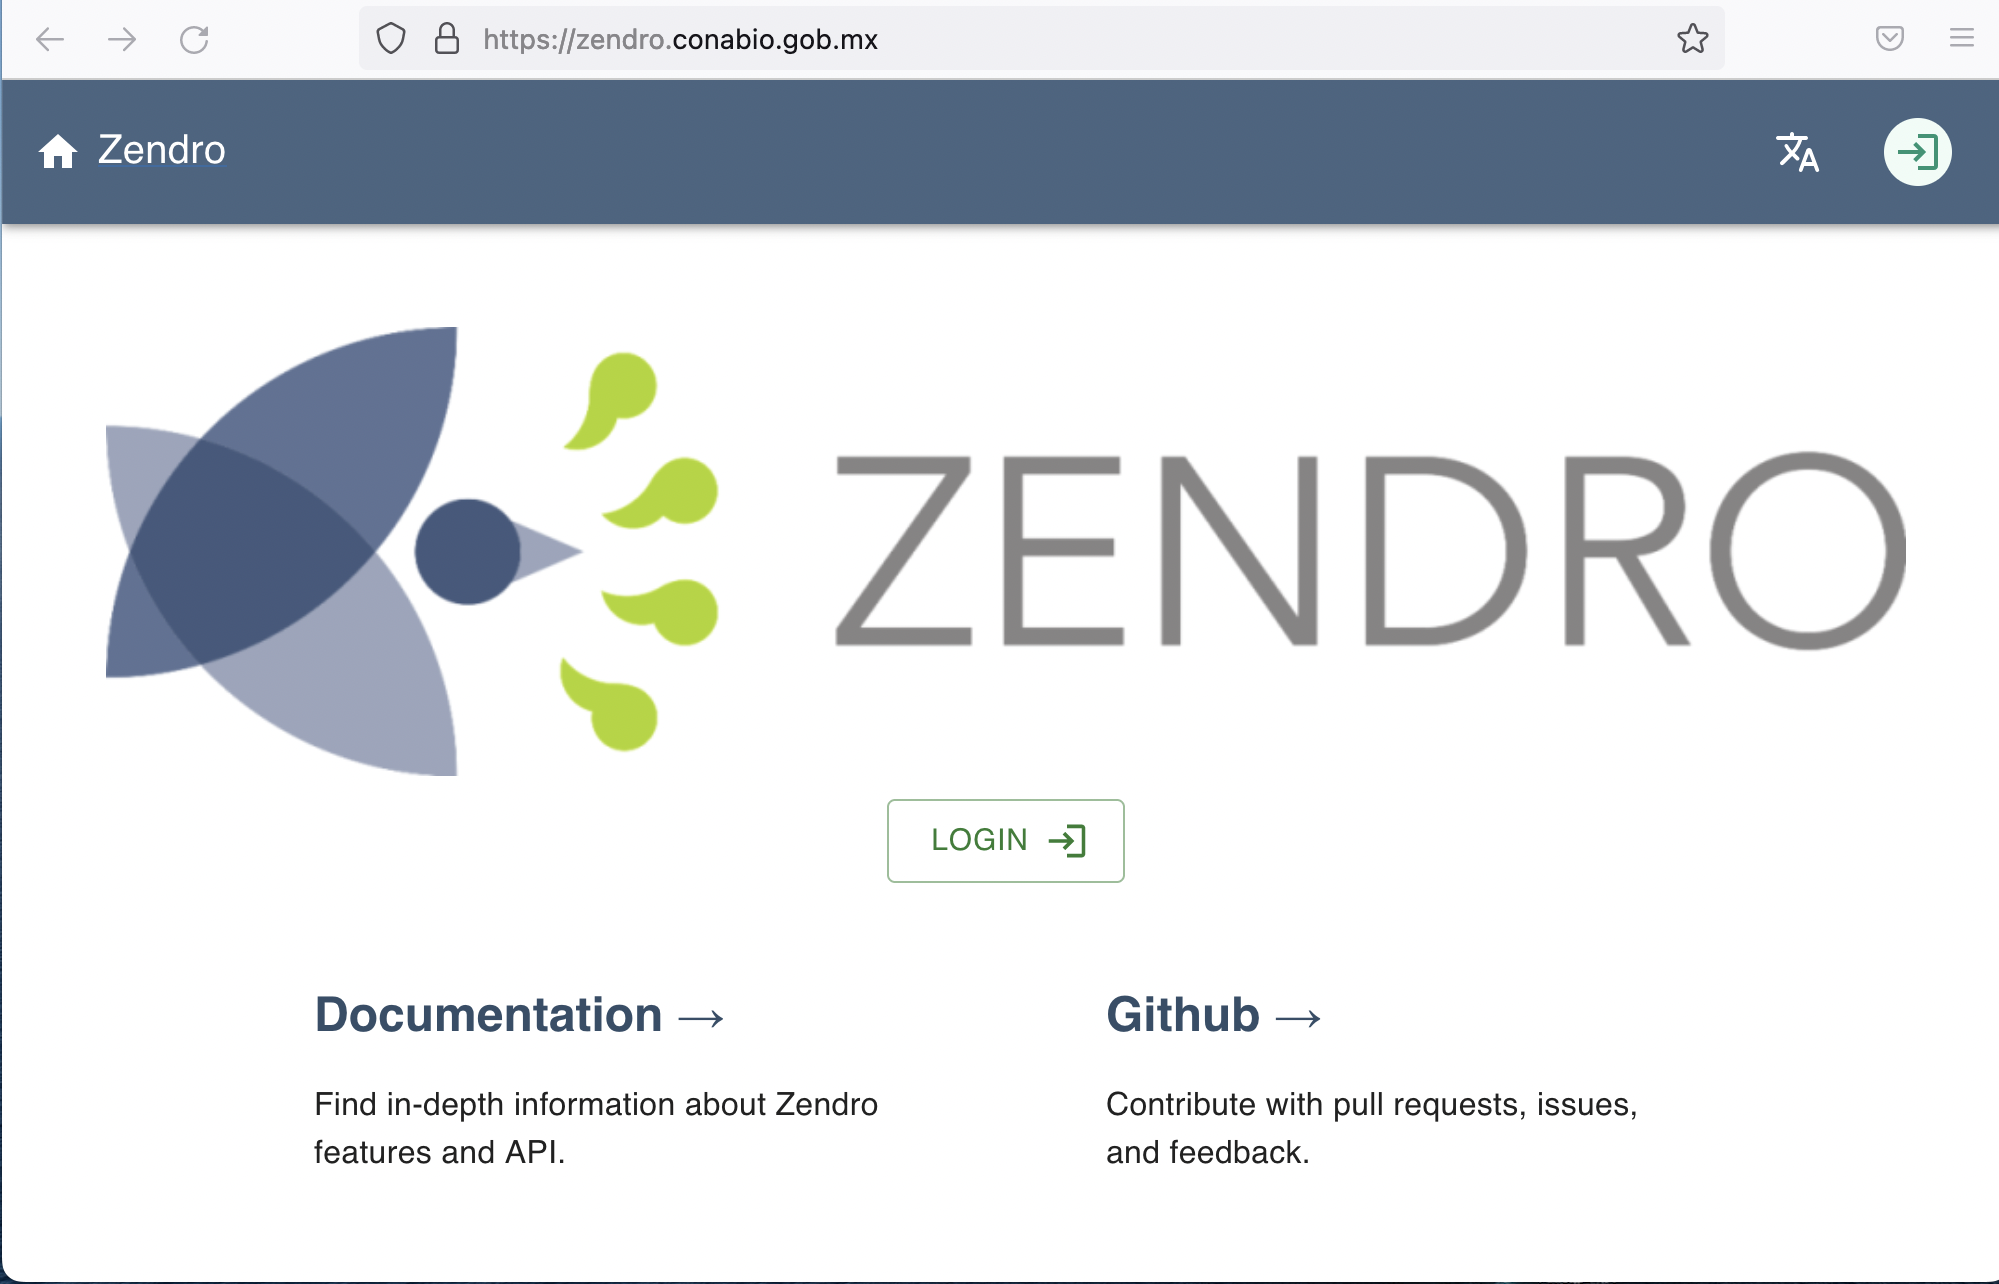
All data administration functions in the graphical interface are subject to user-based access control: a user only sees the respective icons, buttons, and even model names in the main menu, if they have the required access rights for the corresponding read or write operations. The screenshots below use an account with full CRUD (Create, Read, Update, Delete) rights, so every button is visible — with a read-only account, the edit (“pencil”), delete (“trash”) and record-creation icons simply wouldn’t appear.
Login
Clicking LOGIN redirects you to Zendro’s identity provider (Keycloak by default) to sign in:
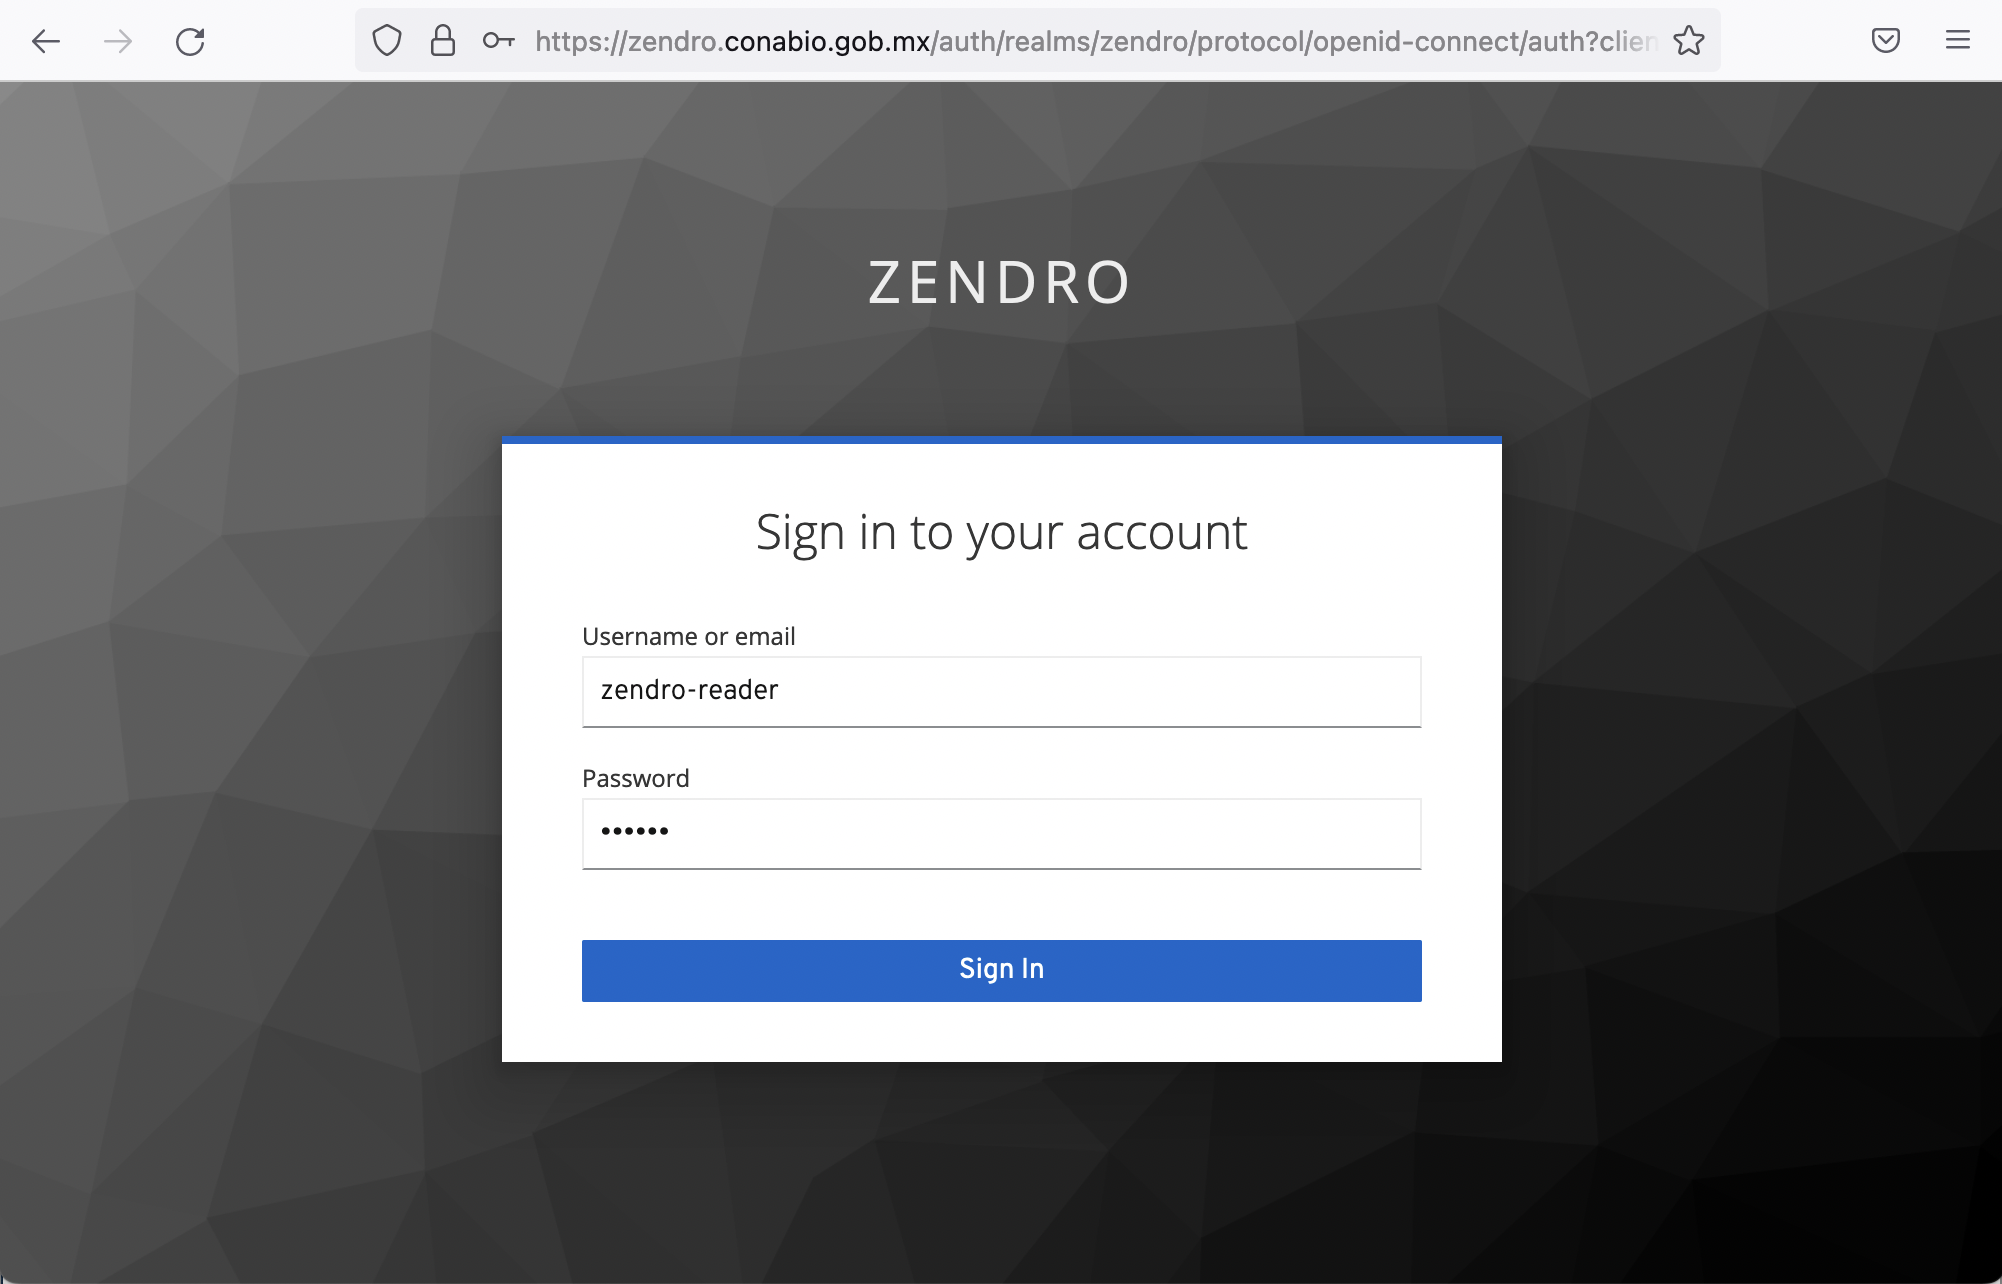
Zendro’s graphical interface lets users Create, Read, Update or Delete (CRUD) records, but you decide which users can do what — for instance, only one or two people on a research team may have edit rights to create, update or delete records, while several other members could be allowed to read only. See Authentication and Roles for how to set this up.
Exploring data
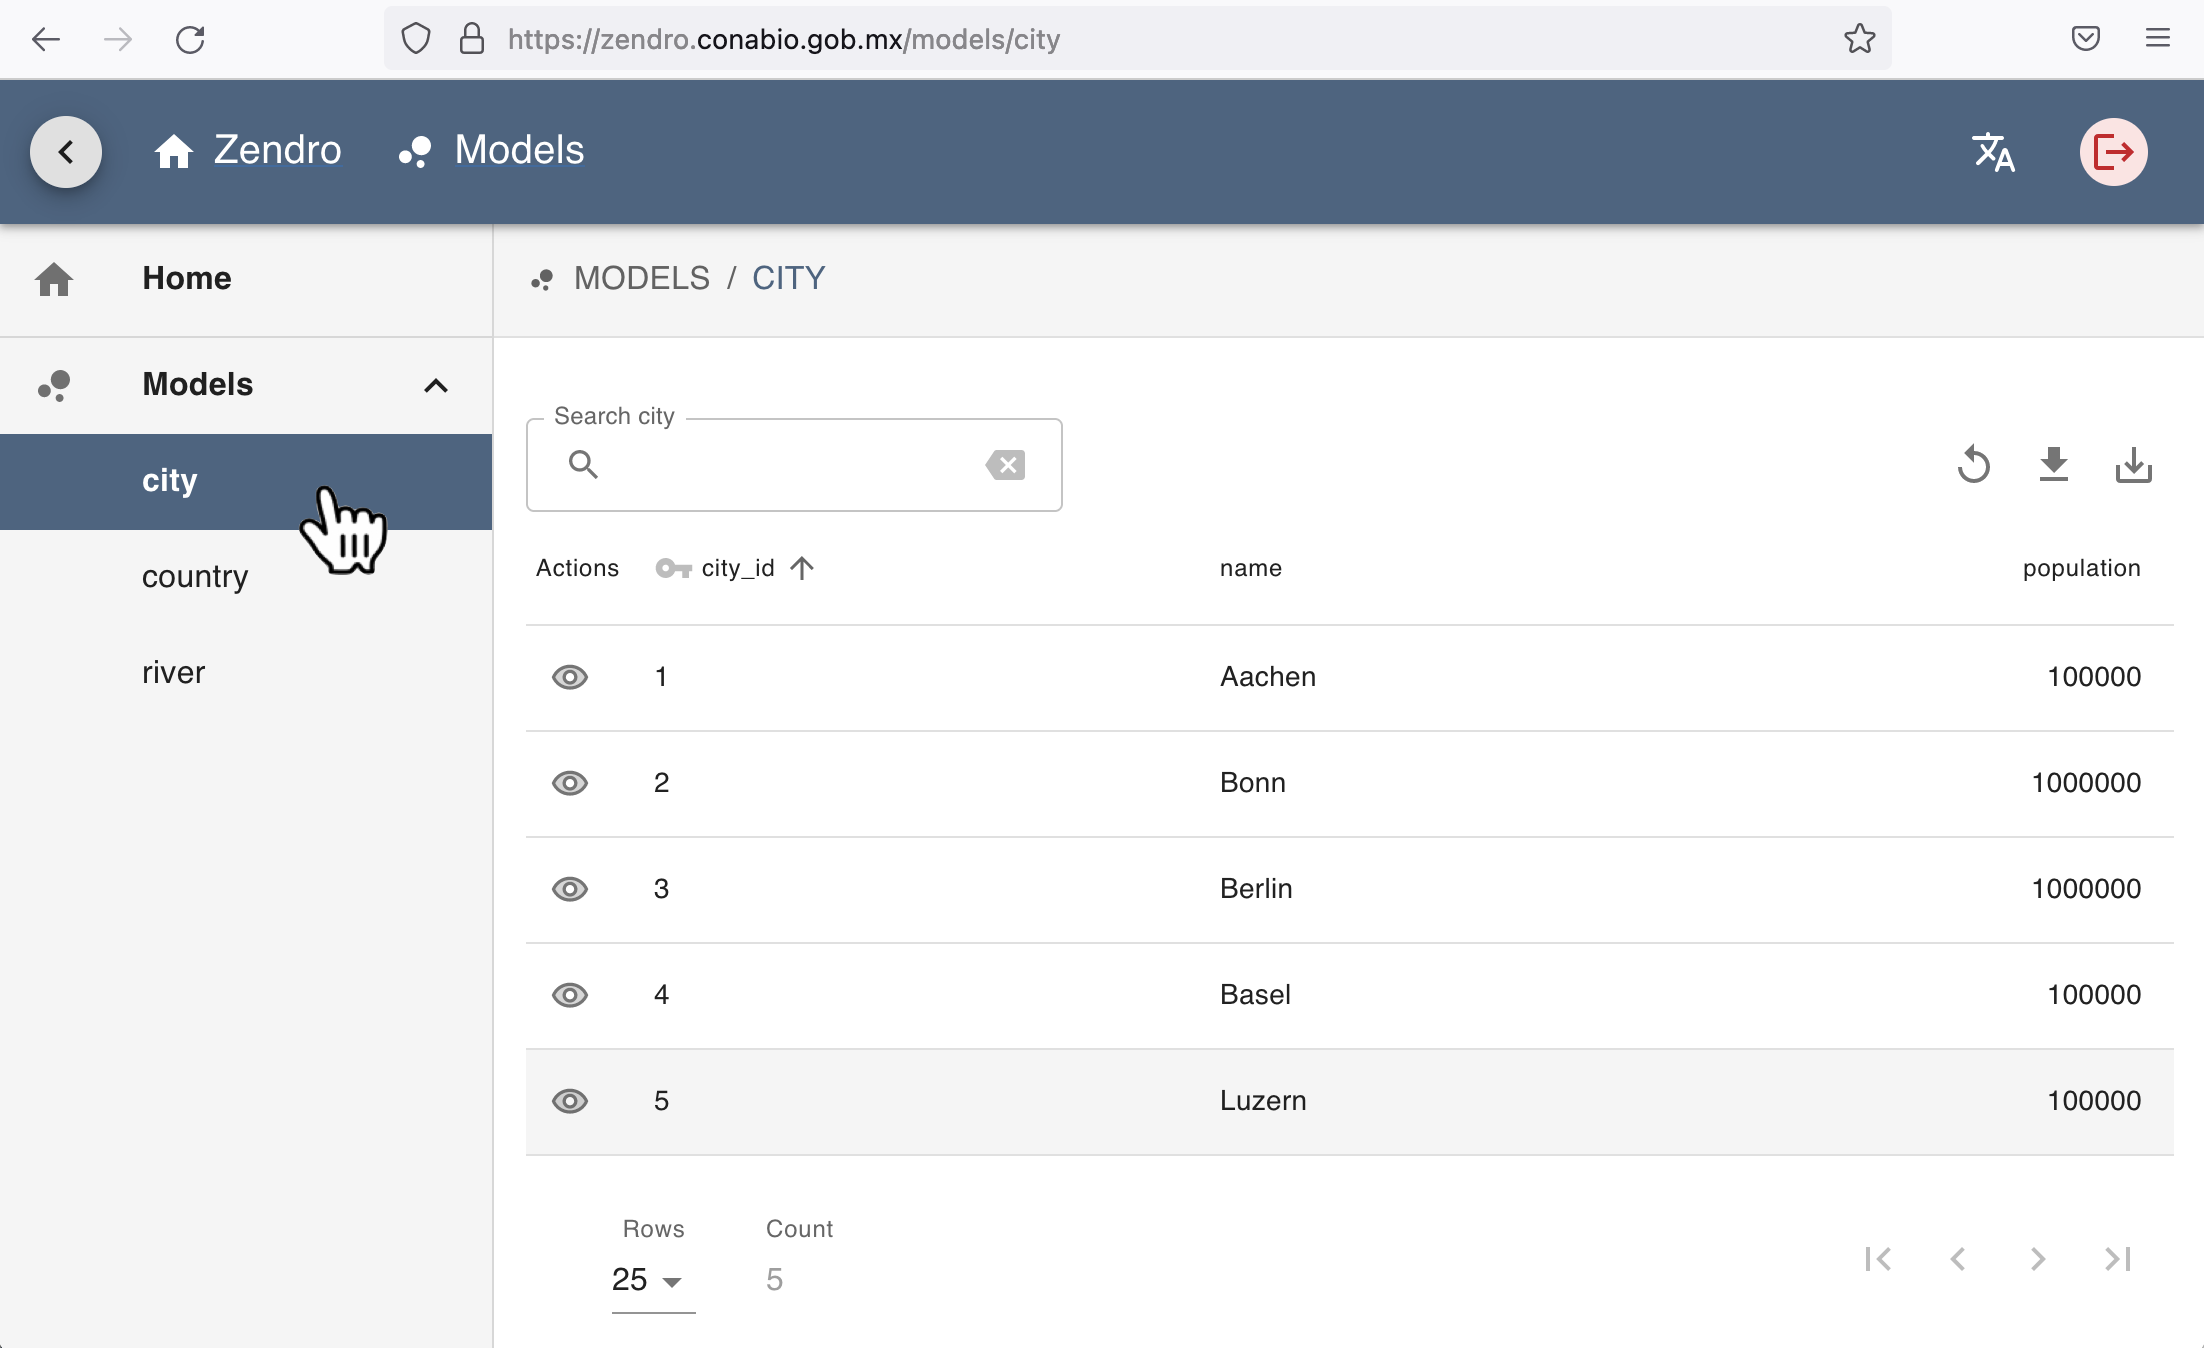
Upon successful sign-in, the user is presented with an overview menu on the left, with one entry per data model — Zendro creates a table for each of the data models provided when setting it up.
In this demo, the models are city, country and river. The home page is blank by default, but you can use this area for models documentation or a project introduction.
Clicking on a data model name presents the main data model table, with a column for each field in the data model (in this example, city_id, name, population and founded for the city model) and a row for each record:
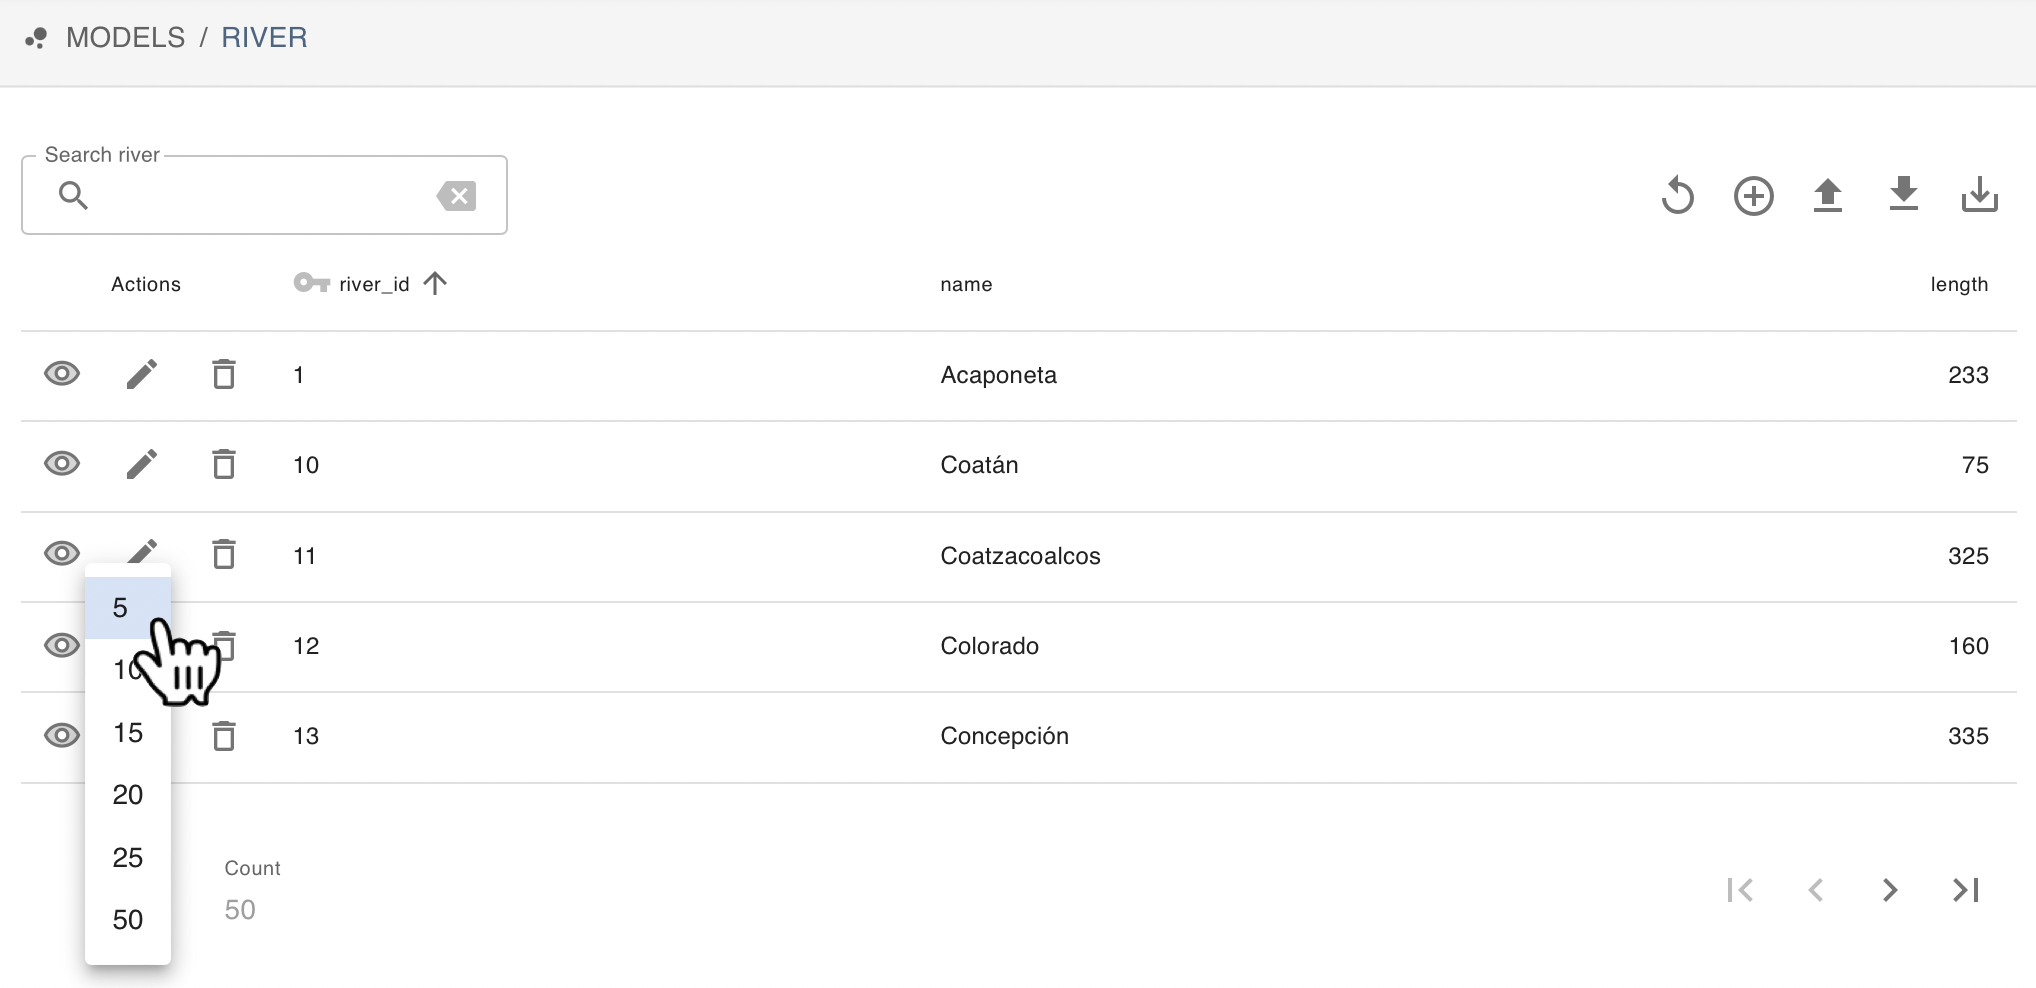
If you’re exploring a table with lots of rows, you can modify the number of rows shown at a time by clicking the number in the lower-left corner — the number of pages adjusts automatically. Try that in the river model:
At the bottom right of the table, you can skip forward or backward through pages:
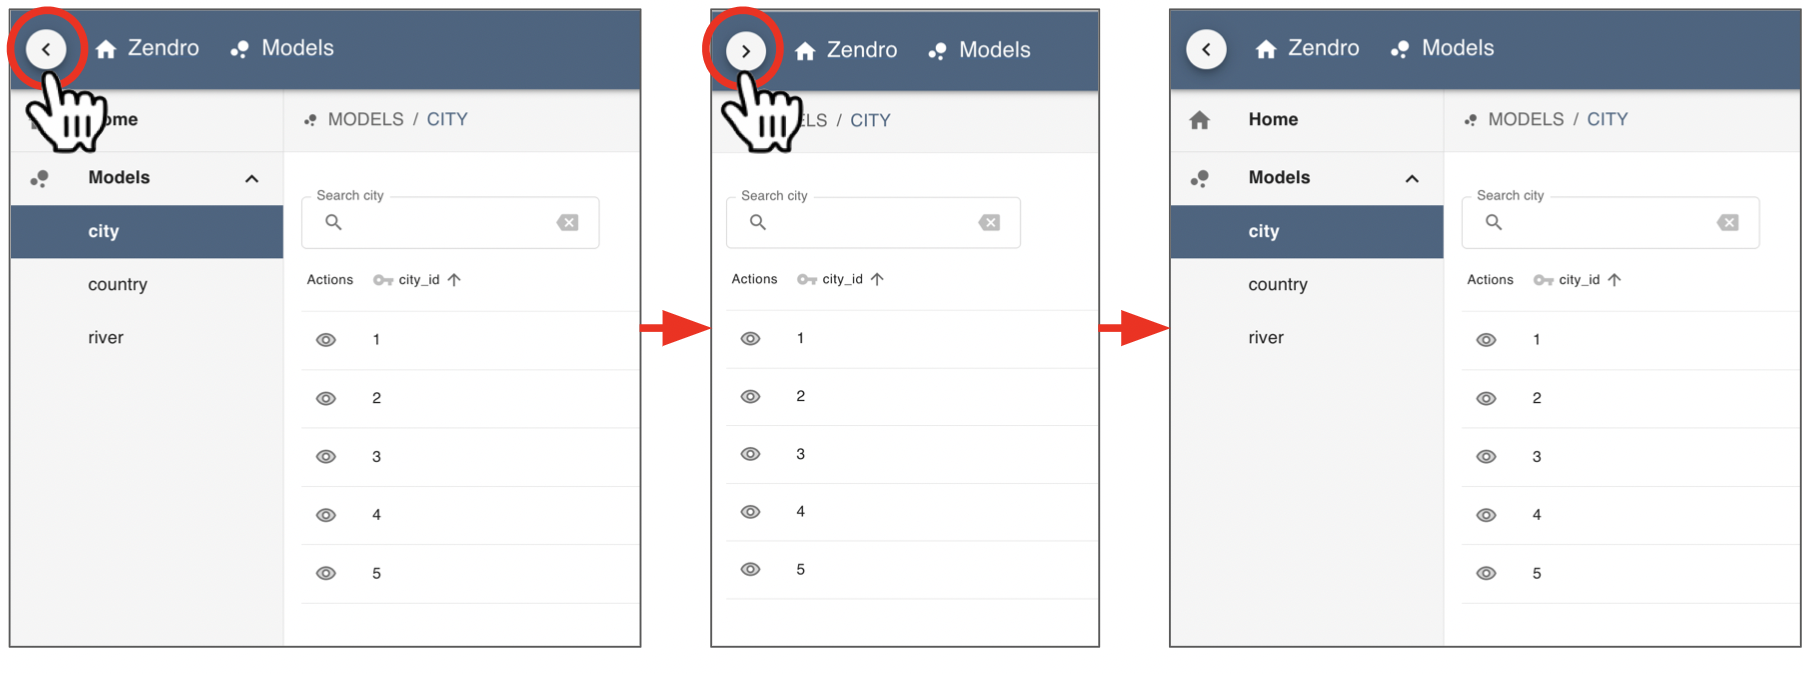
You can hide or expand the data models menu by clicking the arrow icon at the top left, which is especially useful on smaller screens or wide tables:
Clicking a column name sorts the data by that column in ascending (then descending) order. Above the table, you can enter search terms, which are matched against any string (text) column, and against numeric columns if the term can be translated to a number.
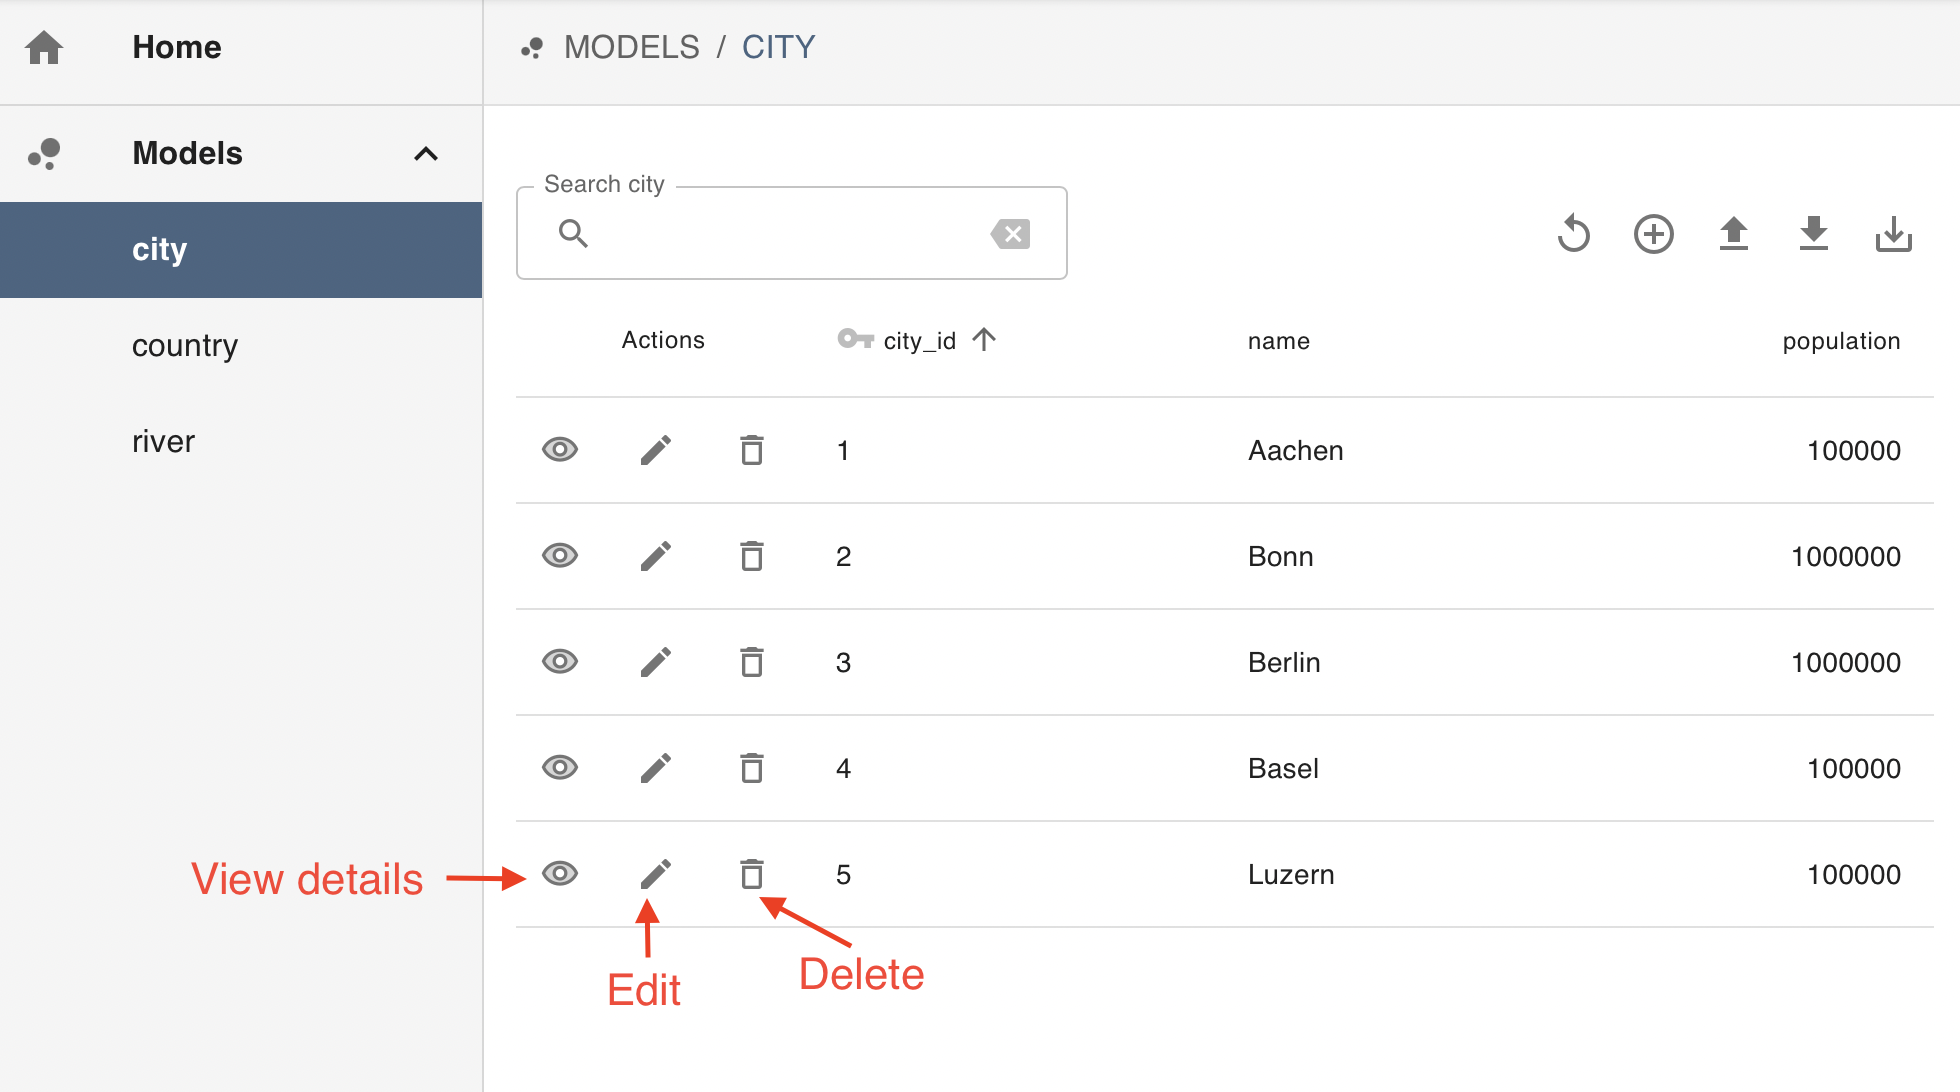
For each record, the table offers the option to open its detailed view (“eye” icon). Users with edit and delete permissions also see options to edit (“pencil” icon) or delete (“trash” icon) the record:
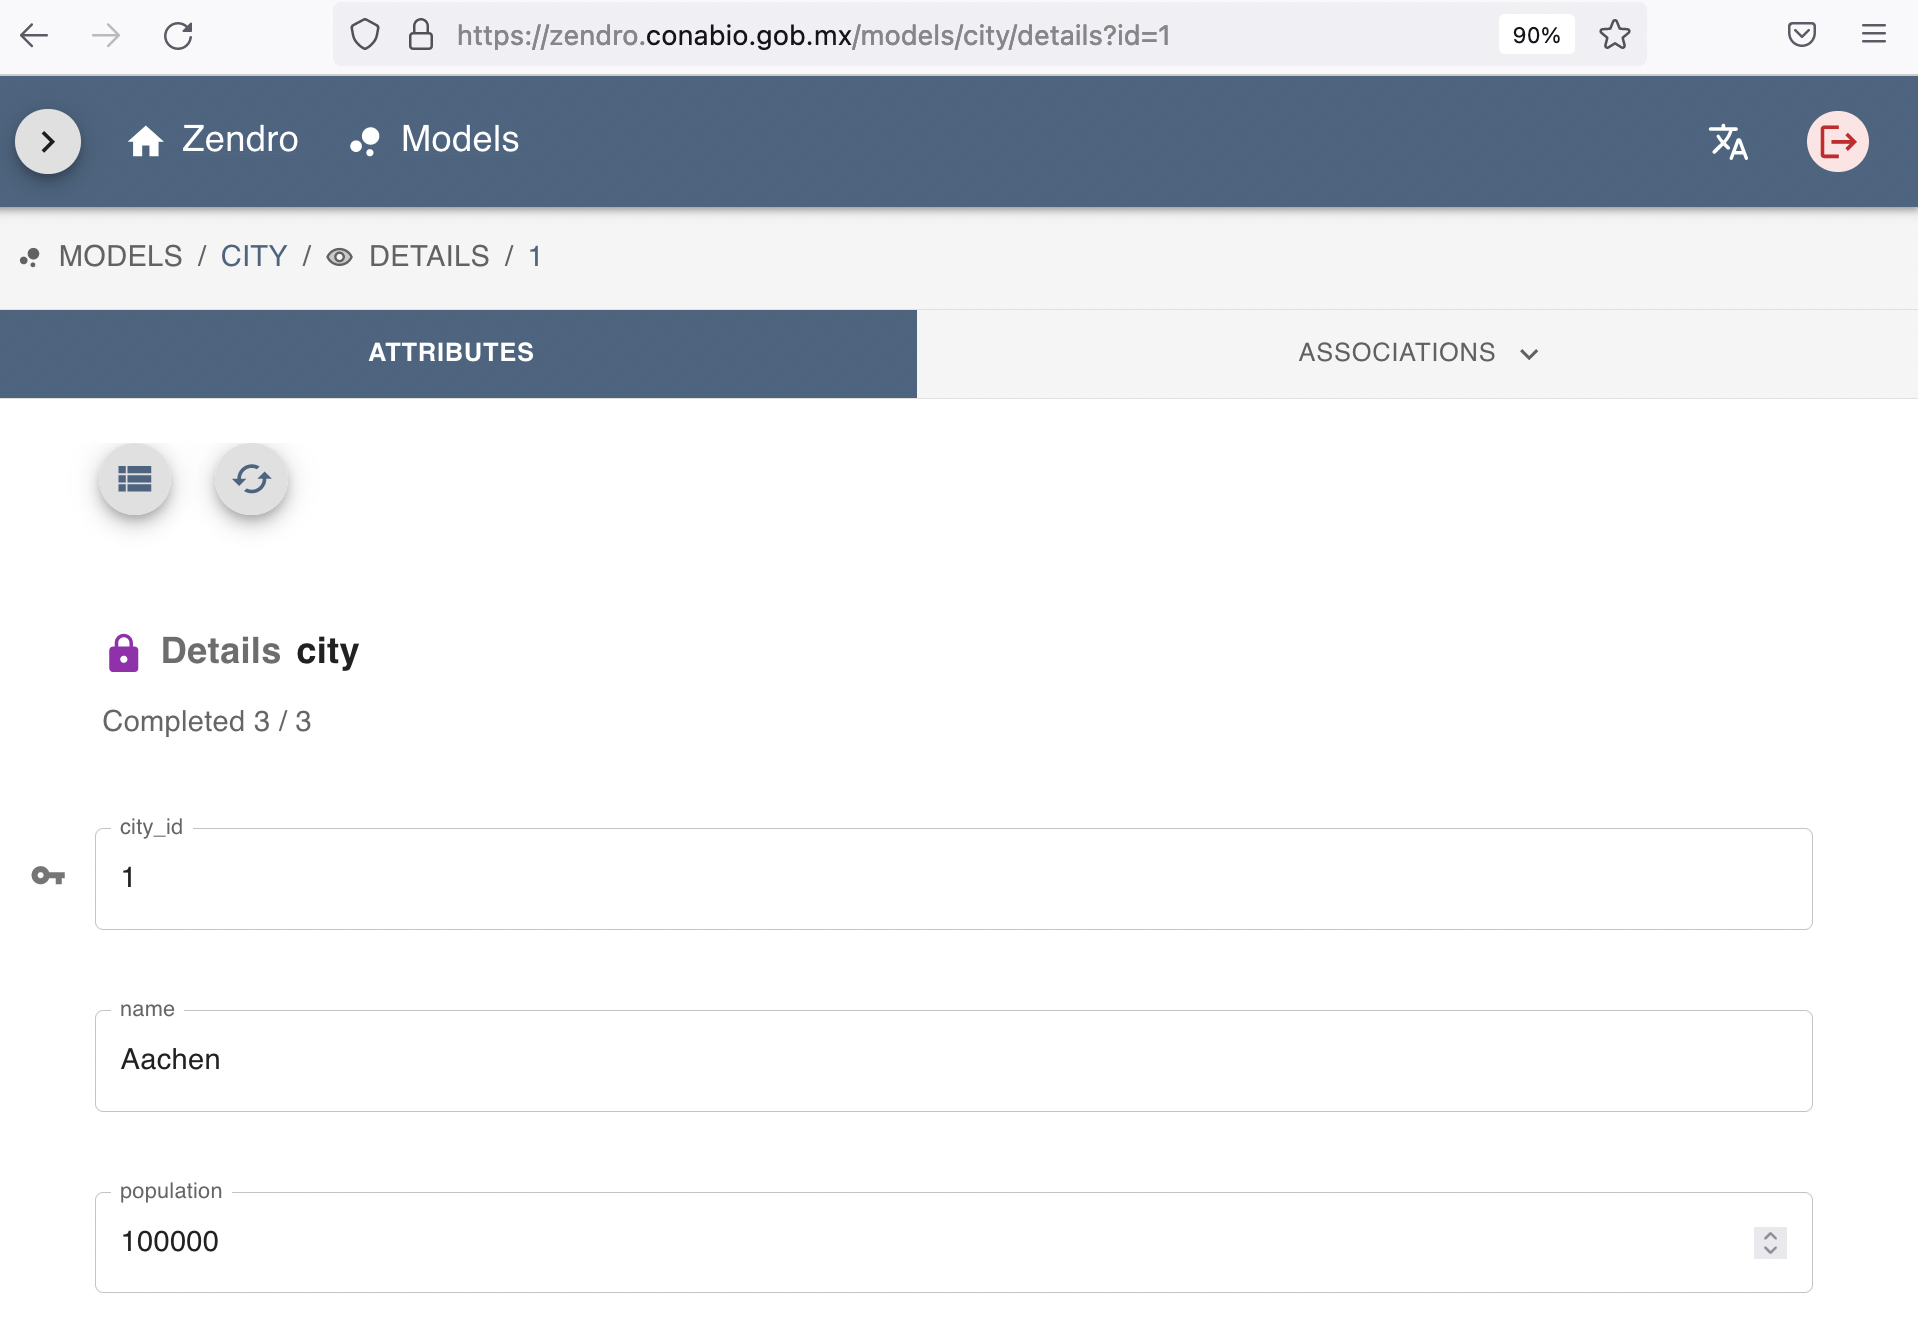
Clicking the “eye” icon opens the detailed view, with full inspection of all details (“ATTRIBUTES” tab) of a single record:
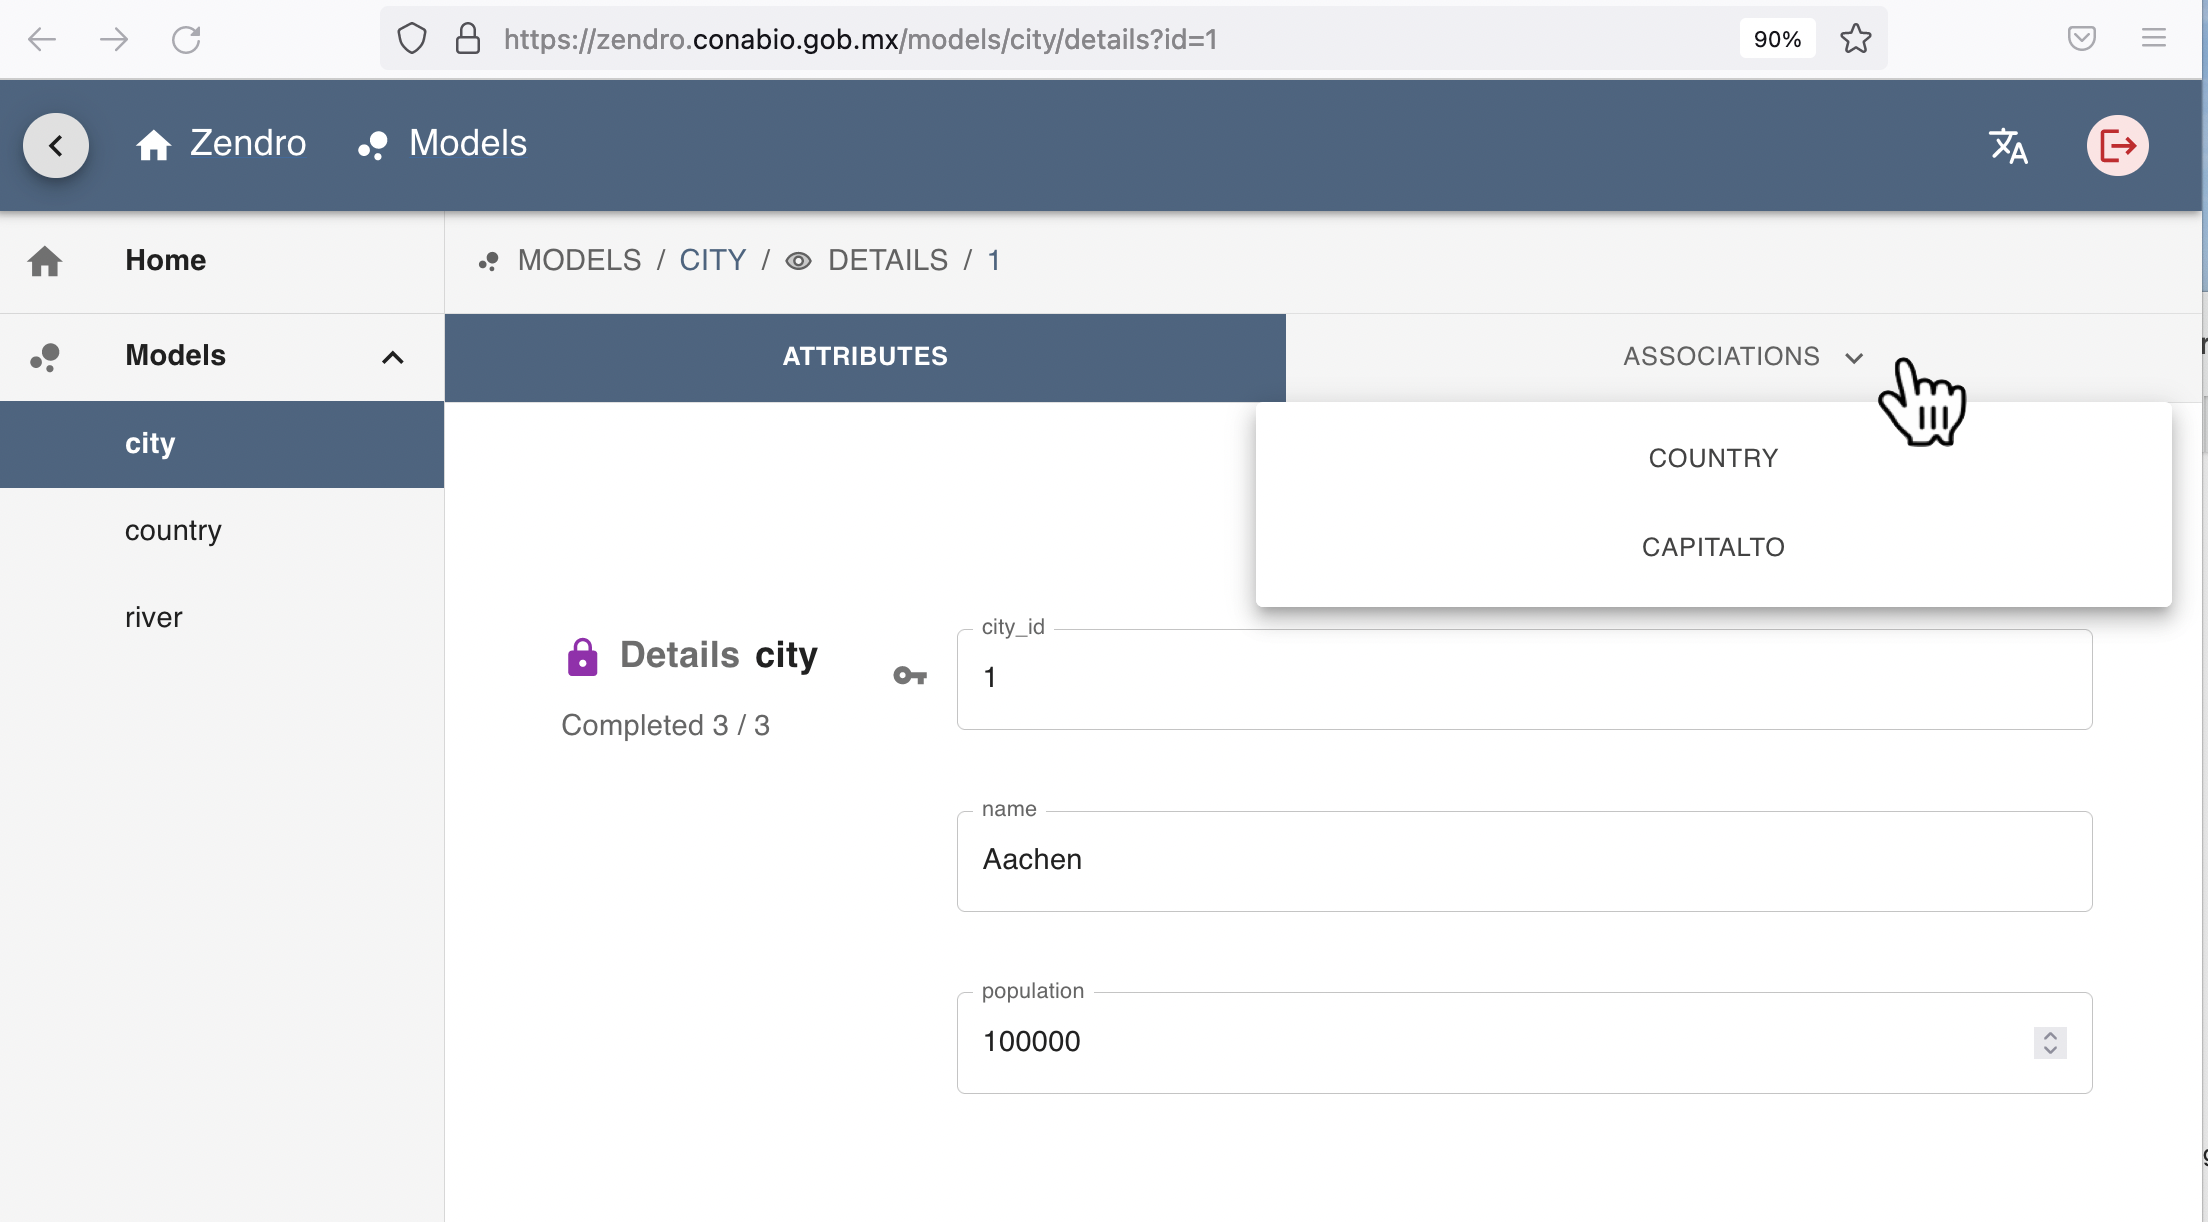
In the detailed view, all users also see an “ASSOCIATIONS” tab at the top right, listing one entry per association the record’s data model has. In this case, the city “Berlin” is associated with COUNTRY (the country it belongs to) and CAPITALTO (the country it’s the capital of):
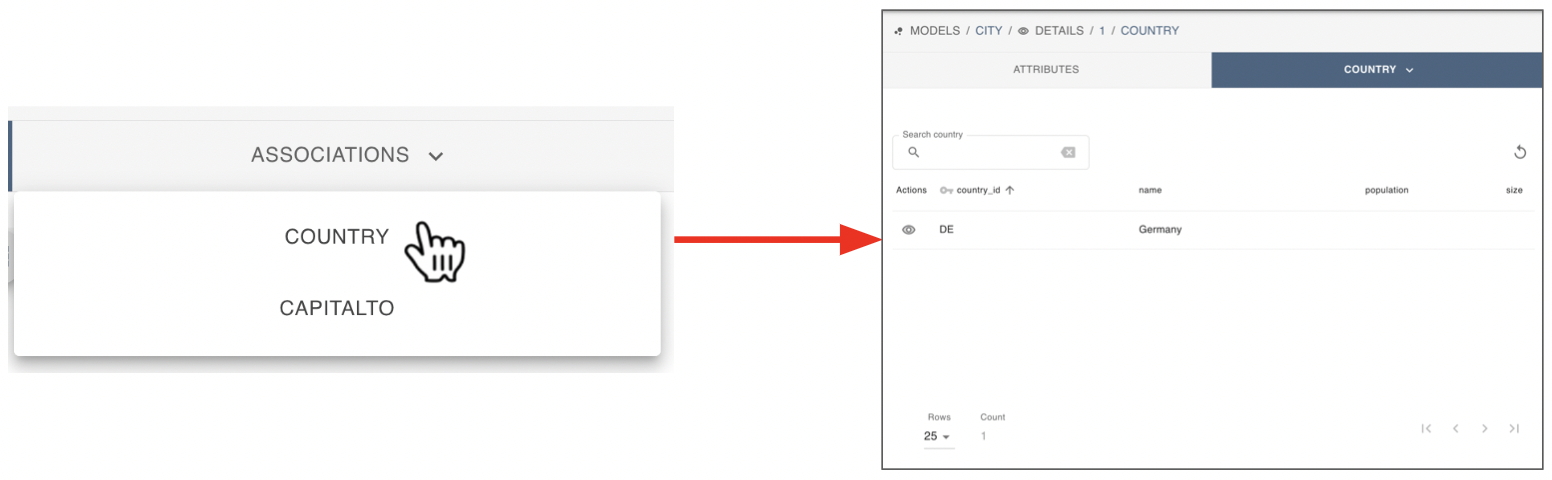
Clicking an association name lets the user inspect the associated record(s). For a one-to-one association like city → country, this shows the single associated record read-only; for a one-to-many or many-to-many association, a full table is shown instead, with the same sorting, search, and pagination functions as the main table:
Editing data
Modify or delete existing records
For a user with full CRUD permissions, the main table offers options to open the detailed view (“eye” icon), edit (“pencil” icon), or delete (“trash” icon) a given record, as shown above.
Clicking the “pencil” icon, either in the main table or the detail view, opens the edit form, pre-filled with the record’s data. Here you can change the data; a validation error shows up if the data is invalid — for example, entering text in the population field, which is defined as an integer, prompts you to enter a valid integer instead:
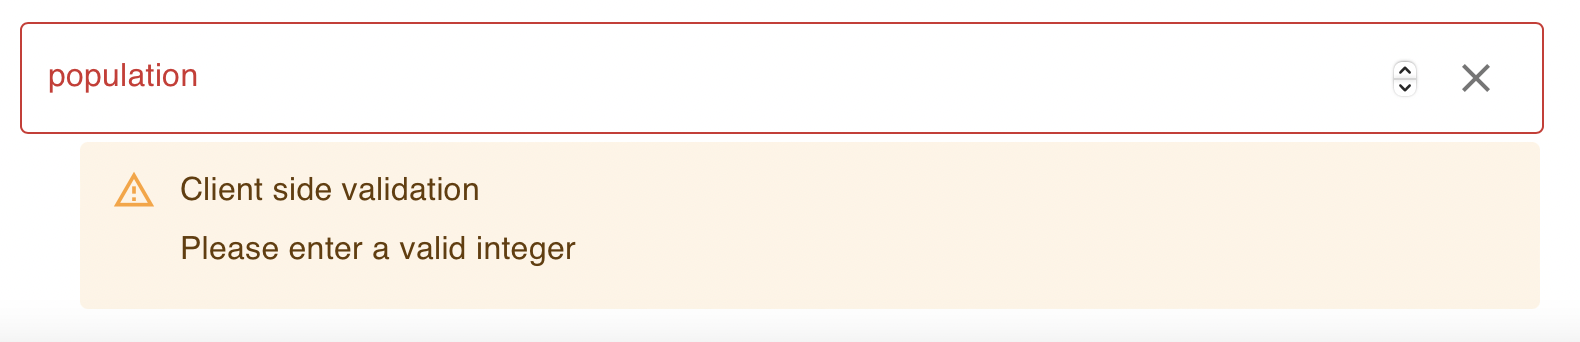
All fields can be modified in this form, except the ID, which links to the record’s associations (shown with a small lock icon).
To edit associations, on the “ASSOCIATIONS” tab click the name of the data model containing the record to associate. For example, editing the country DE (Germany) and clicking RIVERS opens a modified version of the river table, with an additional column to associate or dissociate records with the one being edited. Associated records are marked with a “link chain” icon, unassociated ones with a “broken chain link” icon. You can mark several association changes here, to be executed once you save:
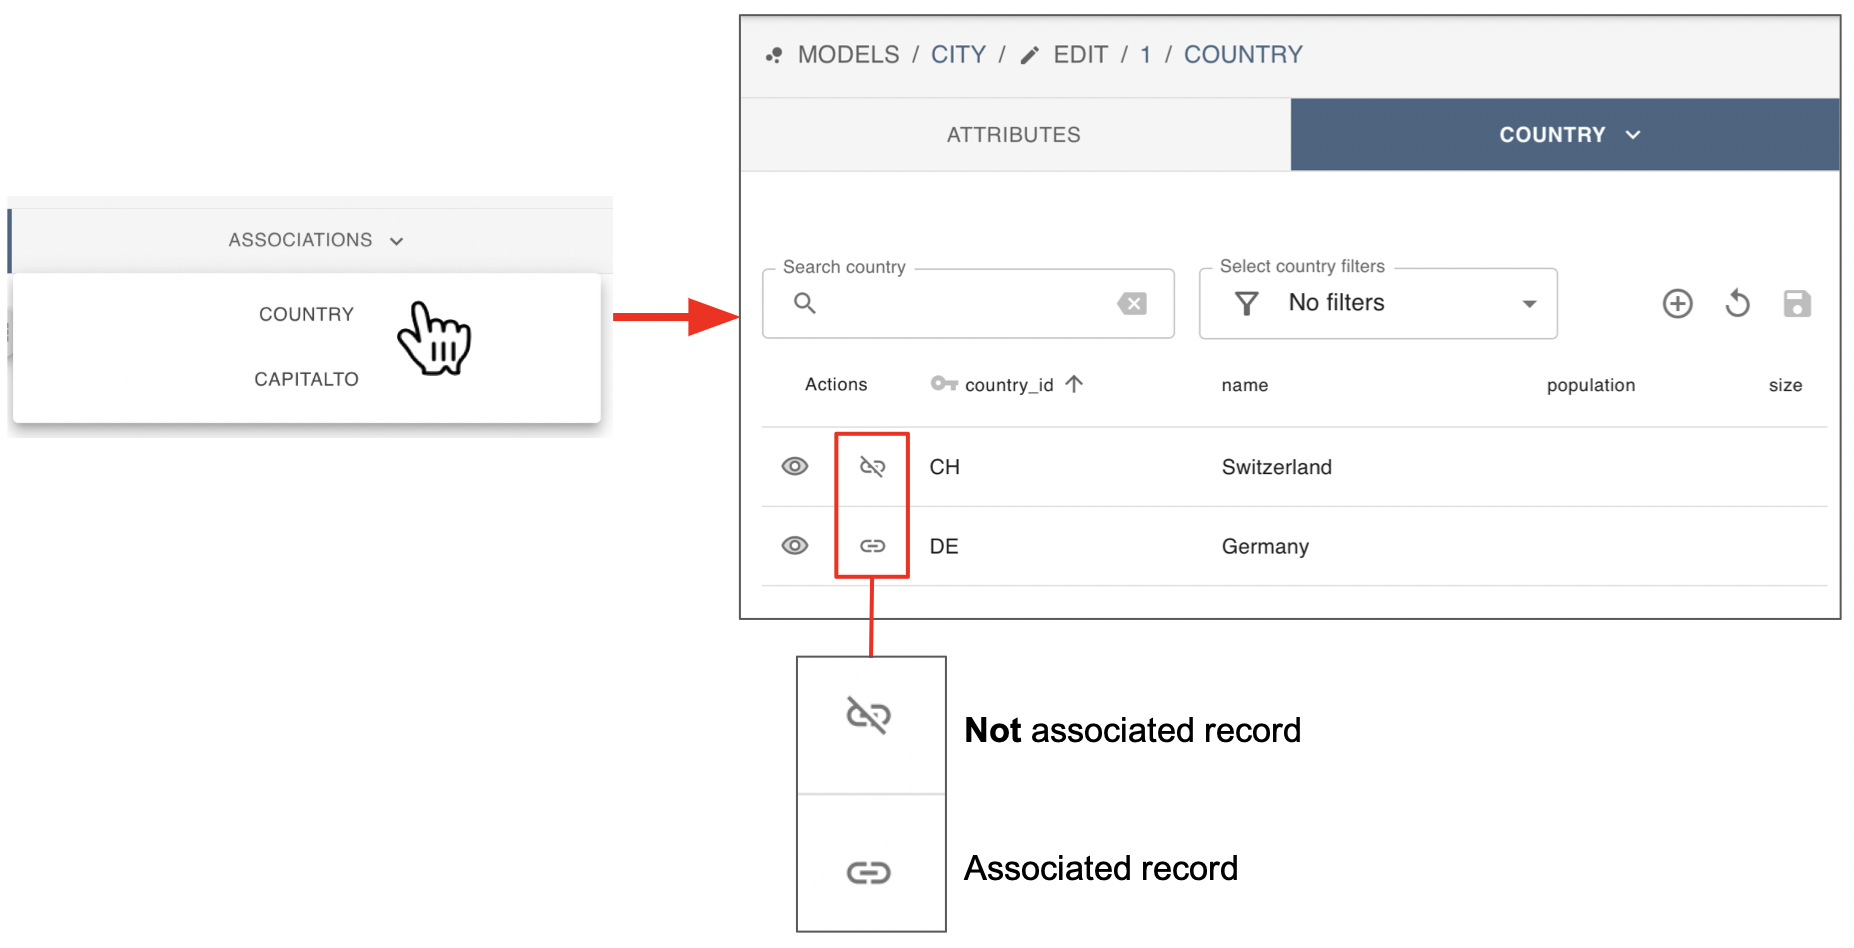
Clicking an associated/unassociated icon flips it to its counterpart — a connected chain link becomes broken, or vice versa. Icons that have been changed are highlighted in color: a green connected chain link indicates an association will be established, a red broken link indicates the opposite. Hovering over a changed icon explains what will happen:
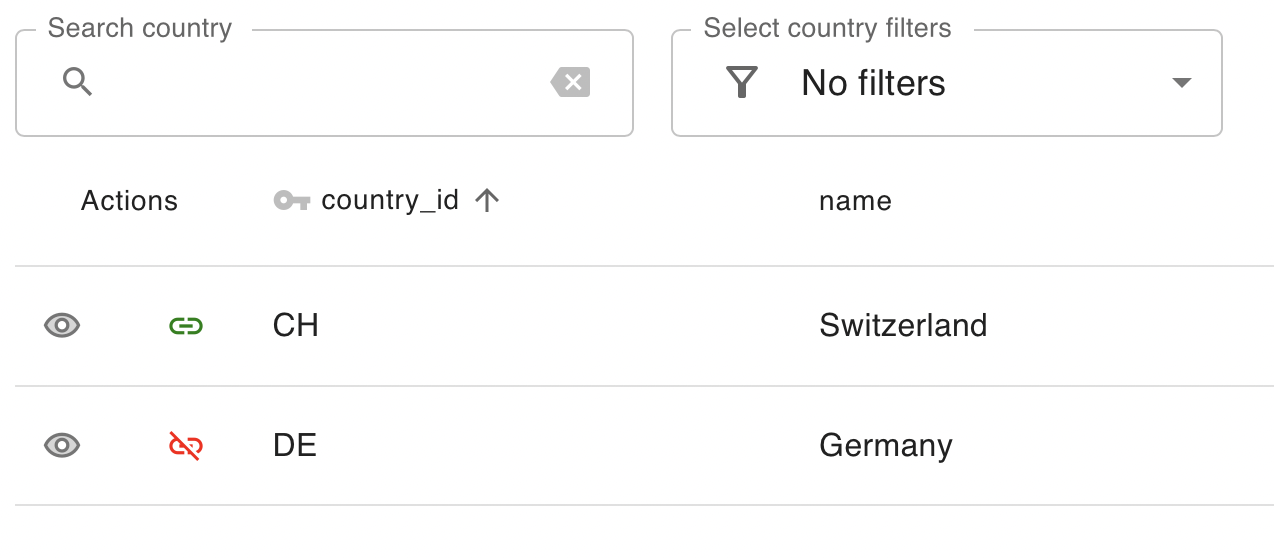
You can paginate through the whole set of records for the association and mark as many changes as you like — they’re collected and carried out once you click “save” (the disk icon) in the top right menu. You can also apply filters, including filtering by already-associated records, or by records marked to be added or removed.
Alternatively, if the record you want to associate doesn’t exist yet, create it directly by clicking the “+” icon in the top right menu:
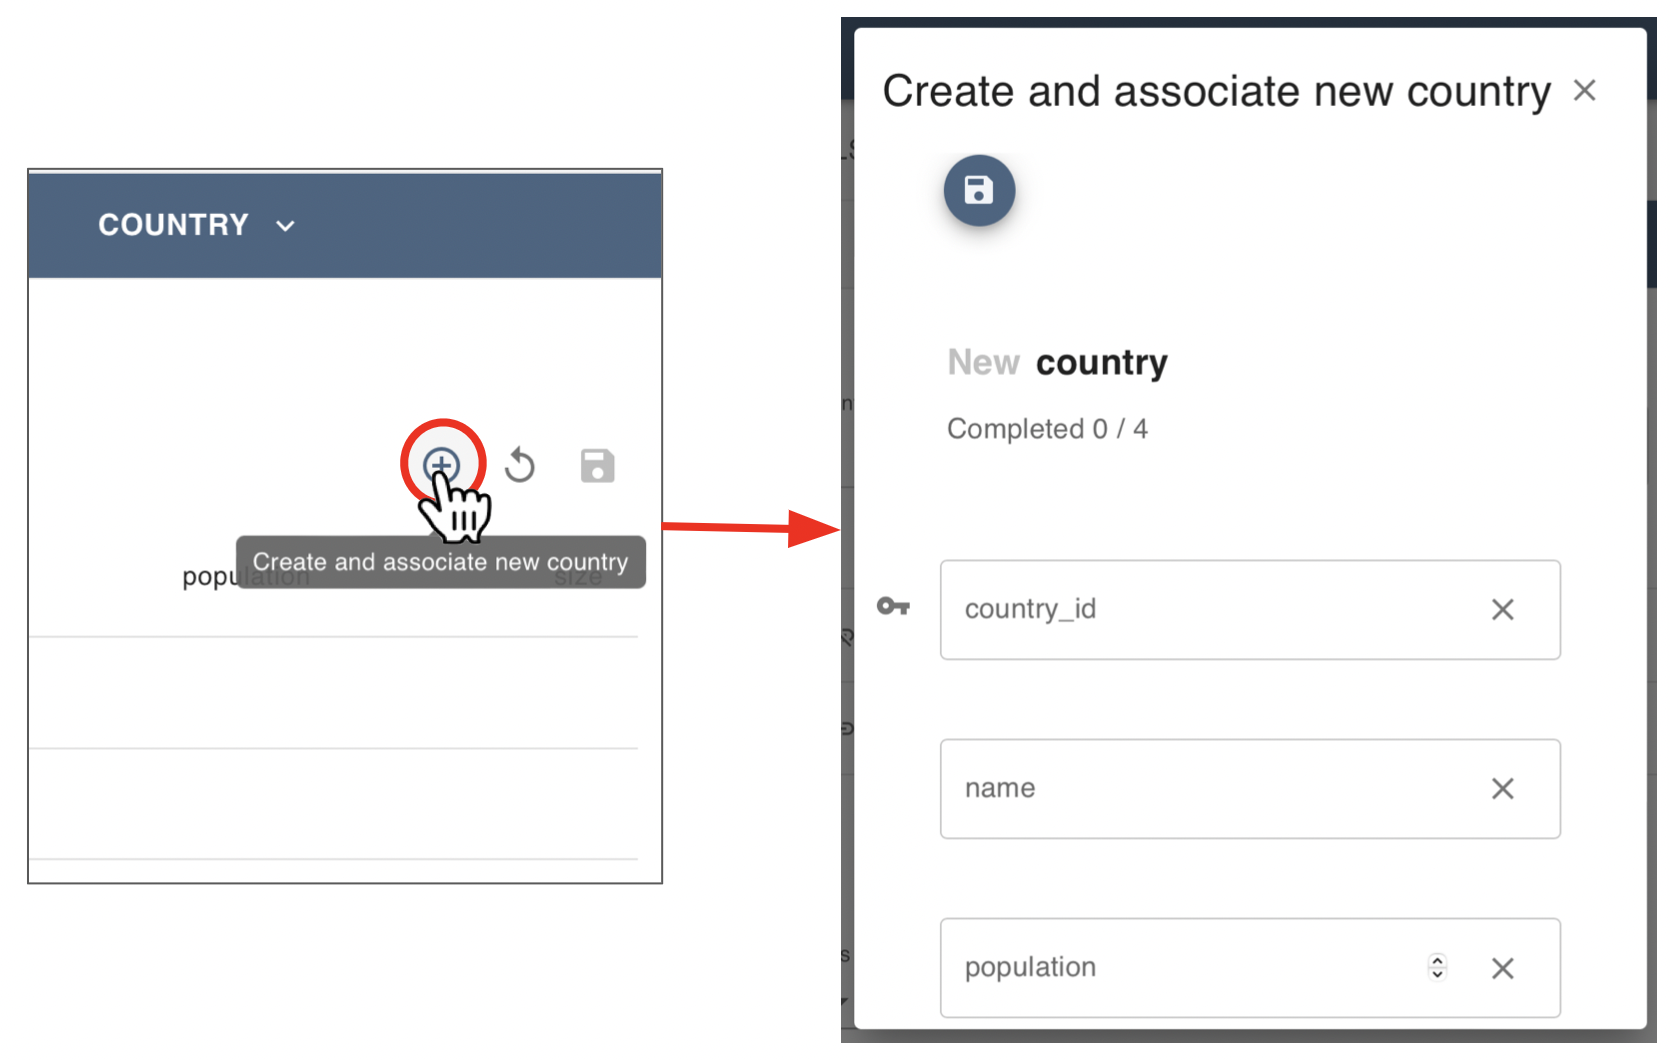
Add new records
If your user has edit permissions, the top bar of the main data model table shows buttons to Reload the data (“circle arrow”), Add a new record (“+”), Import data (“bold top arrow”), Download data as CSV (“bold down arrow”) and Download the model template (“light down arrow”). Read-only users only see the Reload and Download icons.
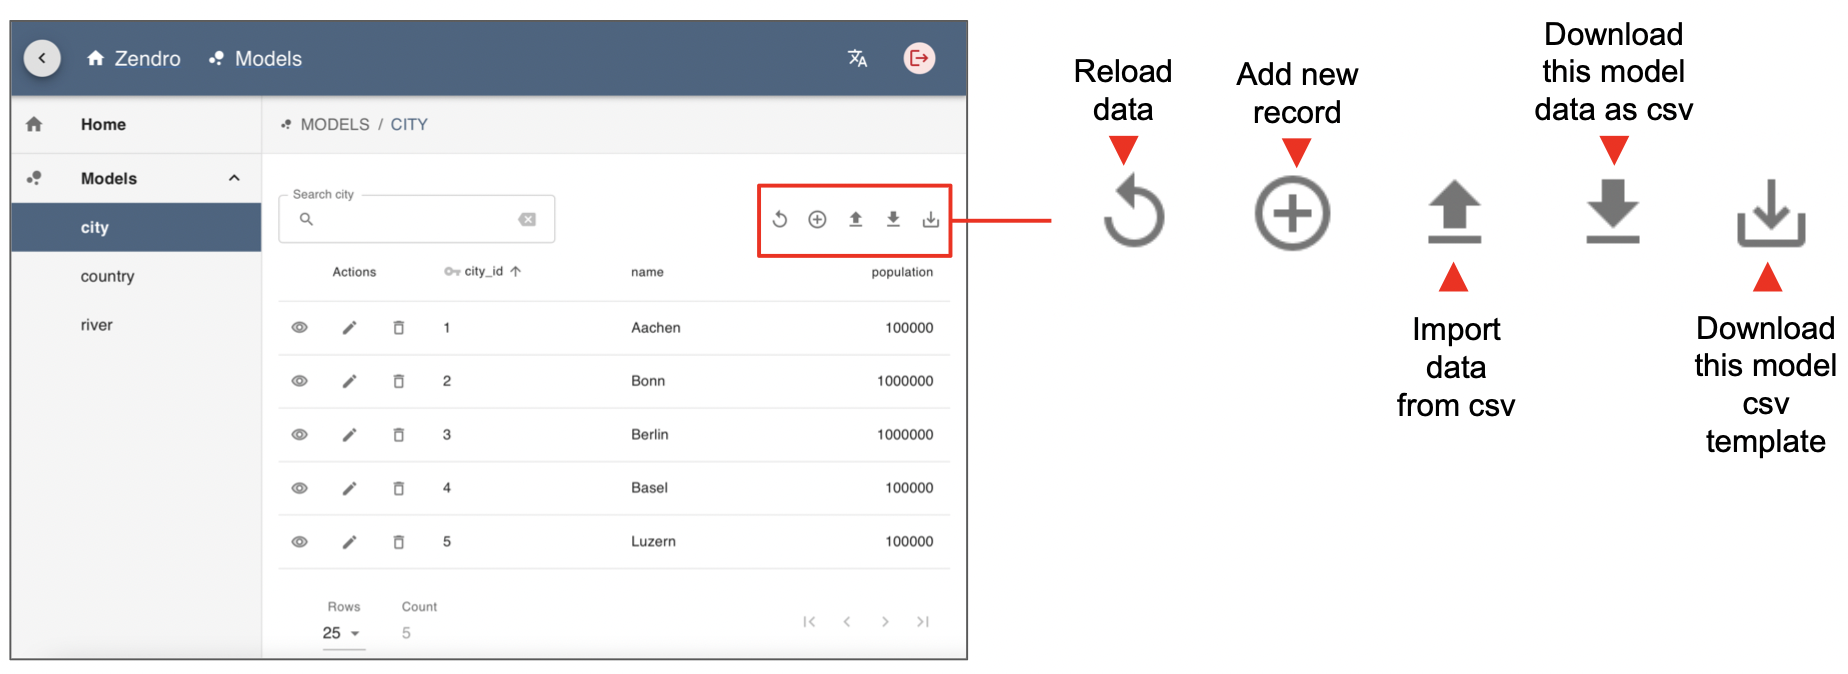
These buttons work independently for each data model table — e.g. if you’re in the city model, you can create or download city records, but to add a country you need to switch to the country model in the left side menu.
Add a single record manually
The “+” icon lets you add a single new data record to the current data table. Clicking it presents a form for entering values for each field:
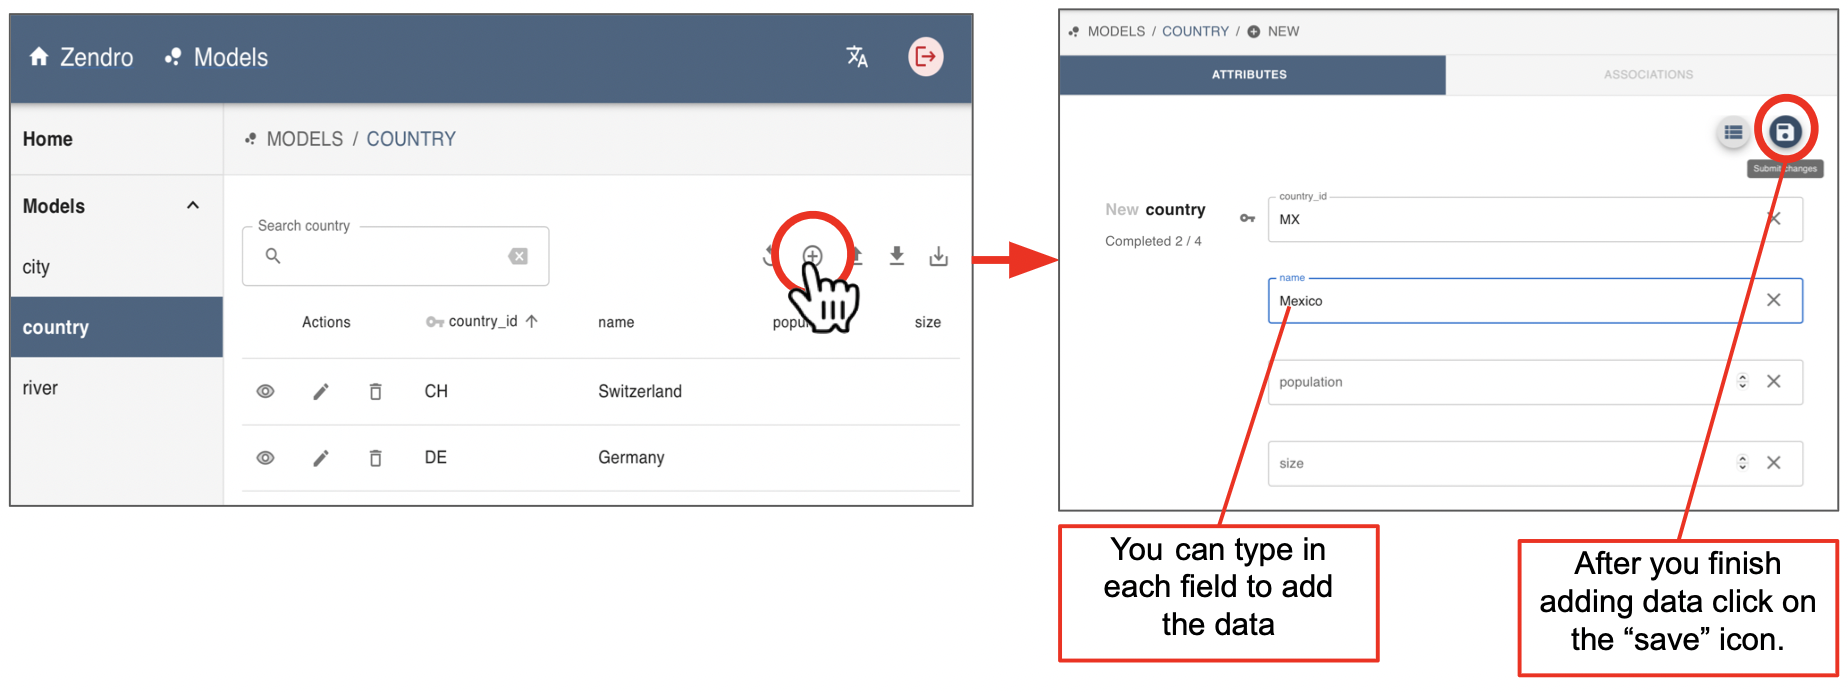
If invalid data is entered and you try to save it, validation error messages appear, as in the edit example above.
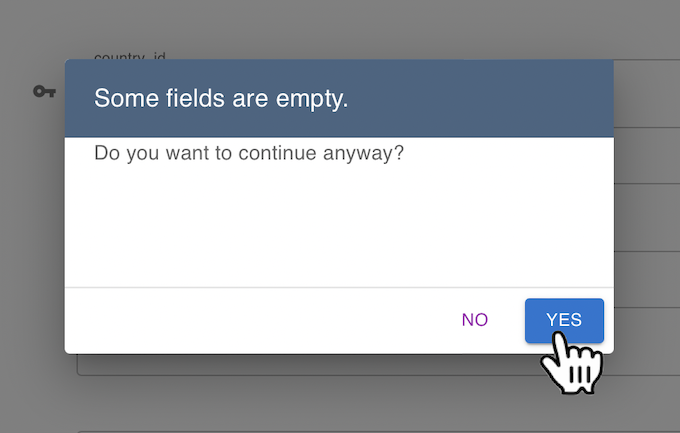
Once you’re done, click the “save” icon. You don’t need to fill in every field, but you’ll be asked to confirm leaving some fields blank — click “yes” to proceed:
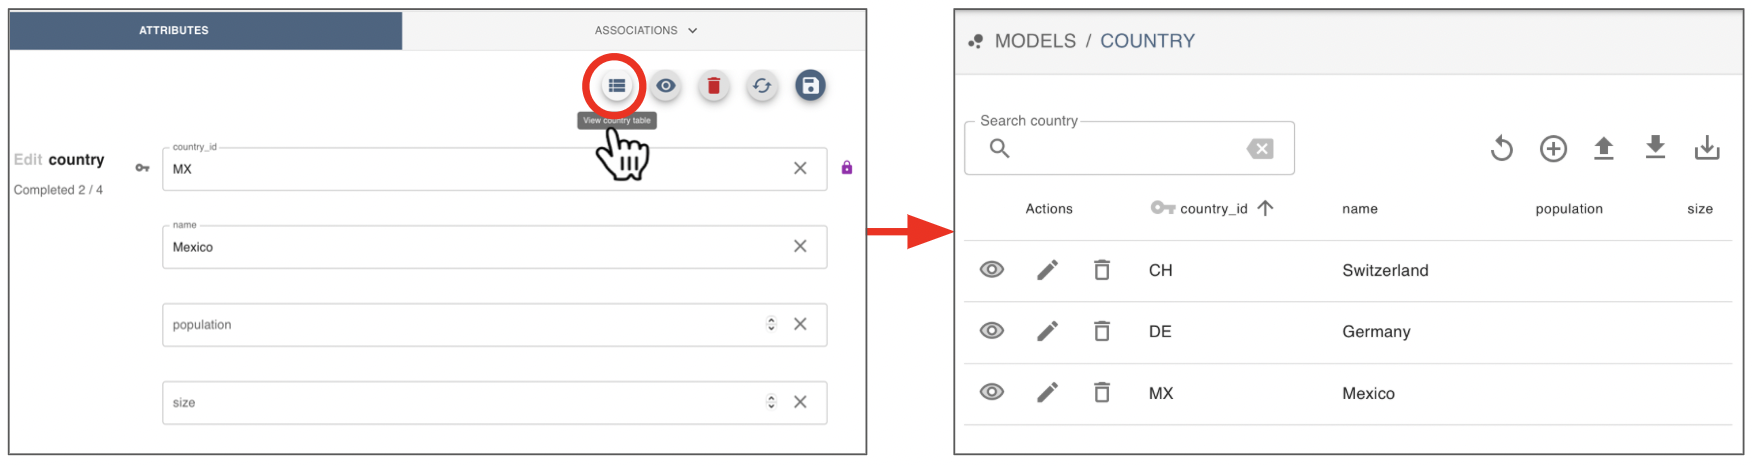
Your new record is saved, and Zendro takes you straight to its edit view. Click the “table” icon (top right) to return to the full table and see it listed alongside the others:
Add several records from a file
Adding single records is sometimes useful, but many users want to add data in bulk — from a table created in MS Excel, recorded with a digital device, or by any other means. You can import an Excel file (.xlsx), a comma separated value file (.csv) or a JSON file. See How to import and export data for the exact format requirements for each option, and how to download a ready-to-fill model template with the “light down arrow” icon.
To upload your data, click Import data (“bold top arrow” icon) in the top right menu — this opens your browser’s native file picker. Select your file to upload it:
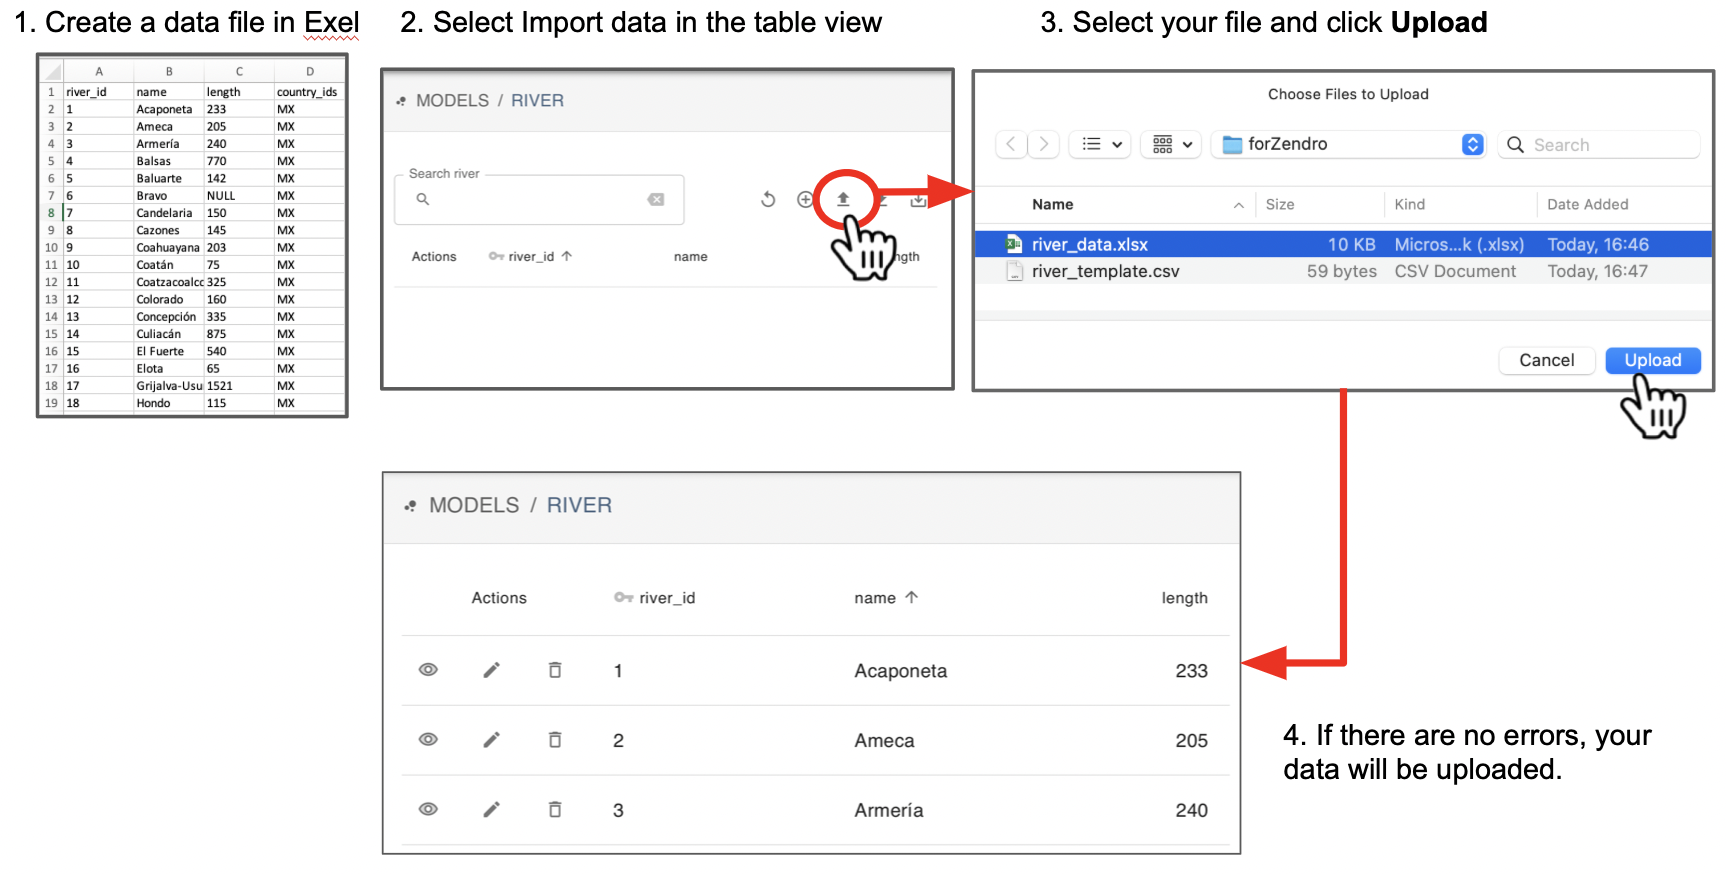
If there are no errors, your data is uploaded — click Reload if you don’t see it right away. If there are errors, you’ll be told what the problem is; check your data and try again.
Download data
To download all the records of a table, click Download data (bold down arrow icon) — your browser downloads a CSV file directly, or prompts you to choose a location, depending on your browser’s settings:
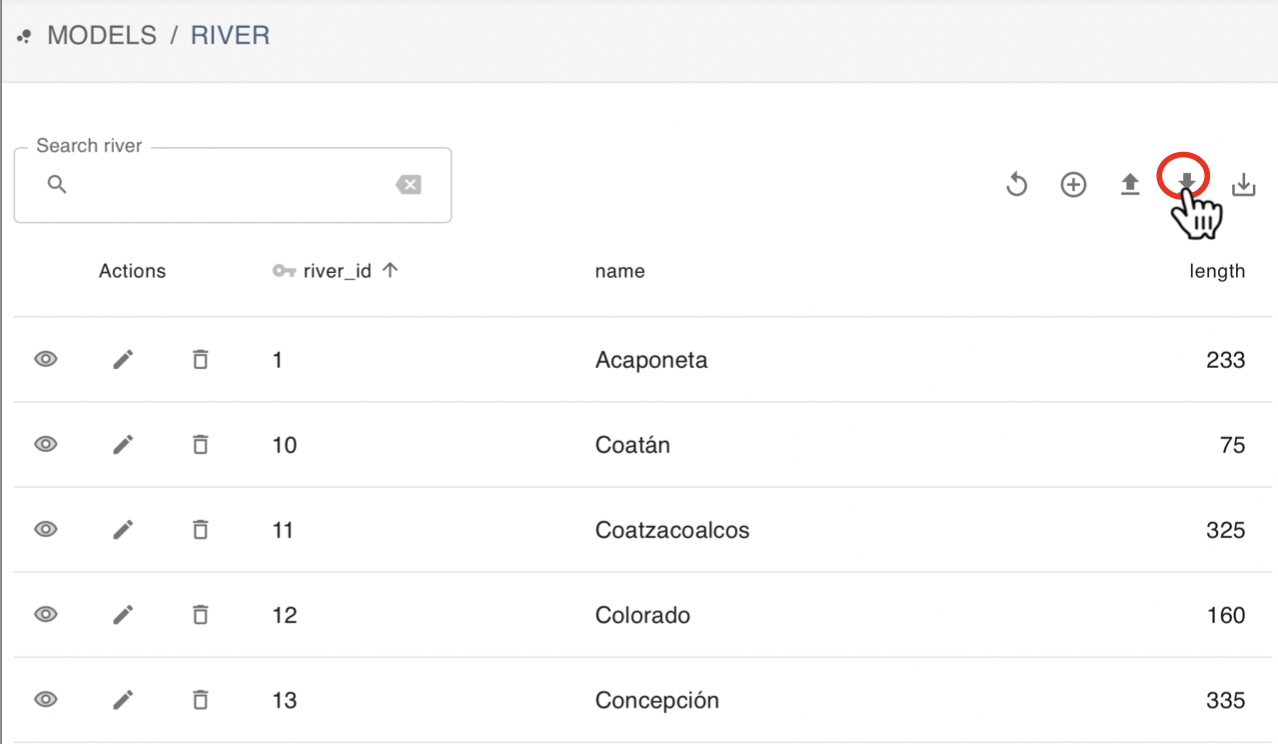
The data is saved in .csv format, which you can open in Excel or import into statistical software like R. This only downloads the data of one table at a time — see How to import and export data for details, and Zendro’s GraphQL API for how to build complex queries that combine columns from different models.